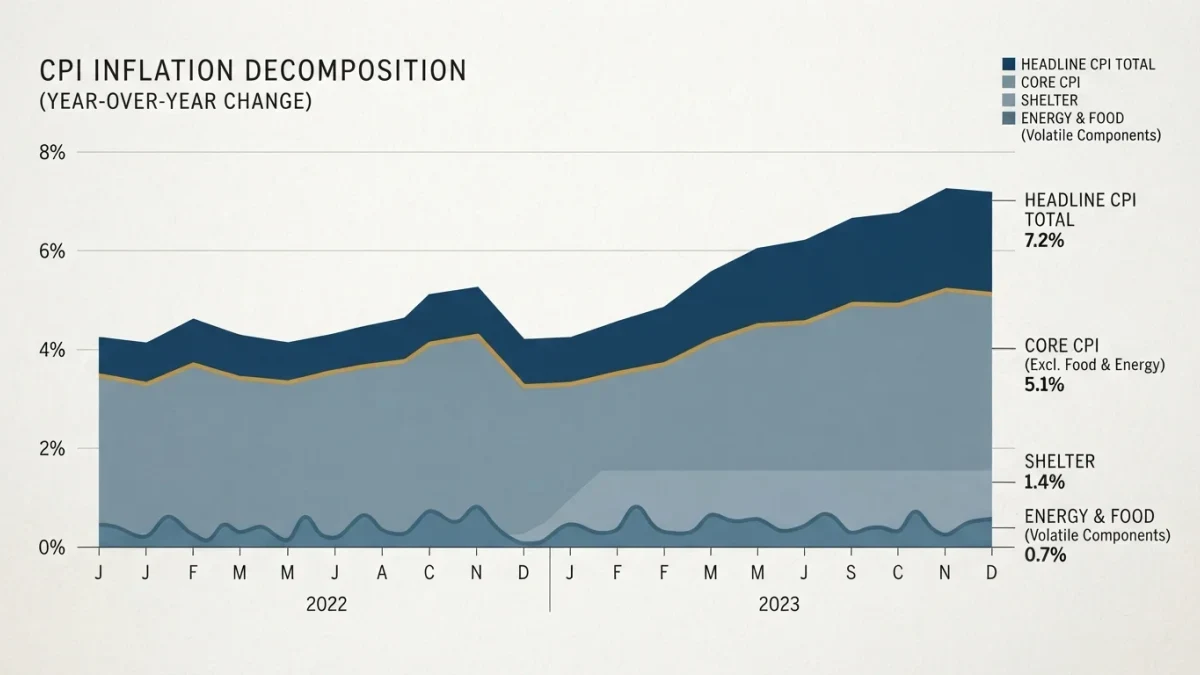
The Consumer Price Index, released monthly by the Bureau of Labor Statistics, is the most quoted economic number in the country — and the least read. The headline figure — the twelve-month change in the average price of a fixed basket — tells a business almost nothing directly. The useful parts are underneath: the category-level indexes that track what you actually buy and sell, and the core index that tells you whether inflation's trend is broad or concentrated. Orer News publishes information, not financial advice.
The BLS publishes the CPI around the middle of each month for the prior month, with full tables by category, and the data is free.
Which parts of the report matter for pricing?
Three. Category detail: if you run a bakery, the indexes for flour and prepared flour mixes, for dairy, and for energy for your ovens describe your input world far better than the average of everything. Services inflation: the categories for rent, medical services, and the like set the wages-and-overhead floor your business competes against — sustained services inflation is the signal that your own labor costs keep rising. And the core index, which strips food and energy precisely because they are volatile: core is the trend gauge the Fed watches, so it previews the rate environment your credit line reprices against.
How do you turn it into a pricing input?
Build a personal cost index: weight the CPI categories that match your input mix — say 40 percent food inputs, 25 percent services labor, 15 percent energy, 20 percent other — and track the weighted sum monthly against your own price list. When your personal index runs ahead of your realized price increases for two quarters, the gap is margin you are donating. When your category indexes diverge — energy spiking while food is flat — the report is telling you which line of the cost stack to renegotiate or re-spec first. This is CPI as a management tool, not a scoreboard.
What are the common misreadings?
The first is treating the year-over-year print as a raise schedule: national averages lag your local reality in both directions, and your suppliers' invoices, not the CPI, bind you. The second is ignoring owners' equivalent rent — a large, slowly moving component that dominates the shelter category and can keep headline CPI elevated long after goods prices stabilized; it matters to you mainly through what it does to Fed policy. The third is forgetting revisions and base effects: a single wild month a year ago distorts the twelve-month figure in the opposite direction this year. Category data with a multi-month view corrects all three.
What does CPI have to do with your financing?
Directly: inflation data is a primary input to FOMC decisions, and FOMC decisions reprice prime- and SOFR-linked borrowing within weeks. A business that reads core CPI trends has early warning on its own floating-rate costs — one more reason the core line, not the headline, earns a place in the monthly reading habit.
- Read category indexes, not the headline print
- Weight them into a personal cost index against your price list
- Core CPI previews the rate path for floating debt
- Multi-month views beat single-month reactions
Fifteen minutes with the BLS tables each month, matched against your own invoices, turns the inflation report from anxiety into one of the cheapest competitive-intelligence documents available.