The Treasury yield curve plots the interest rate on government debt against time to maturity, from one month out to thirty years. It matters to operators for one unglamorous reason: every fixed-rate business loan in the country is priced as a Treasury yield of matching maturity plus a credit spread. When the curve moves, the baseline cost of your five-year equipment loan moved first, whether or not anyone mentioned it. Orer News publishes information, not financial advice.
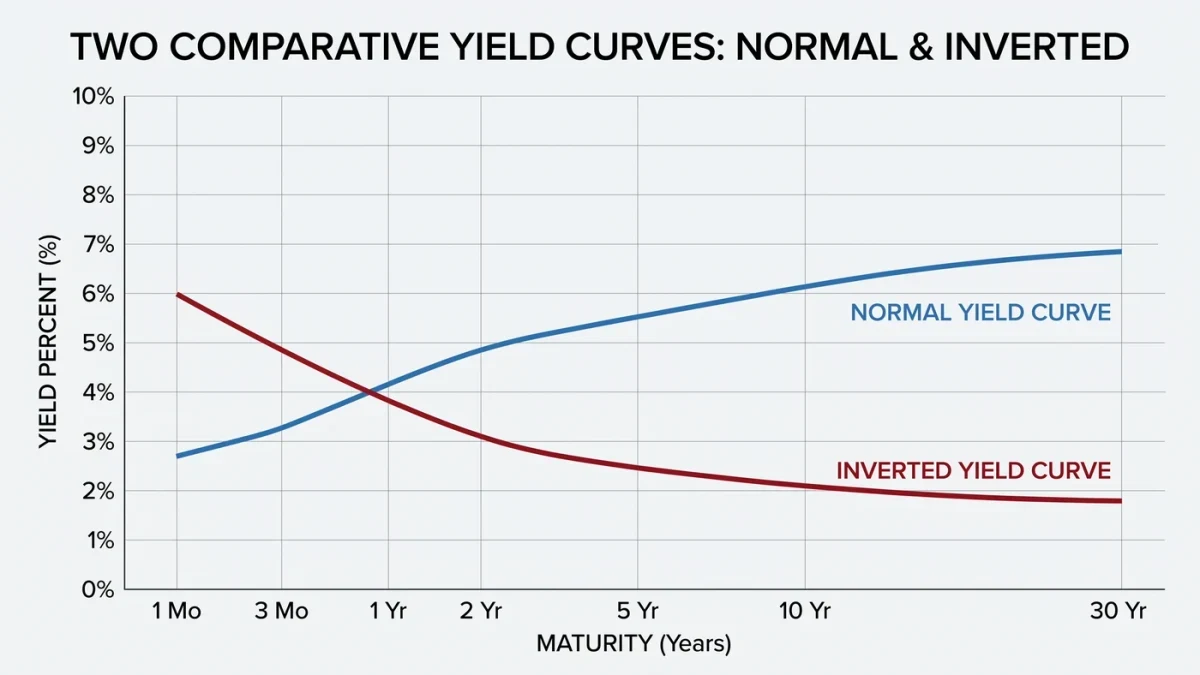
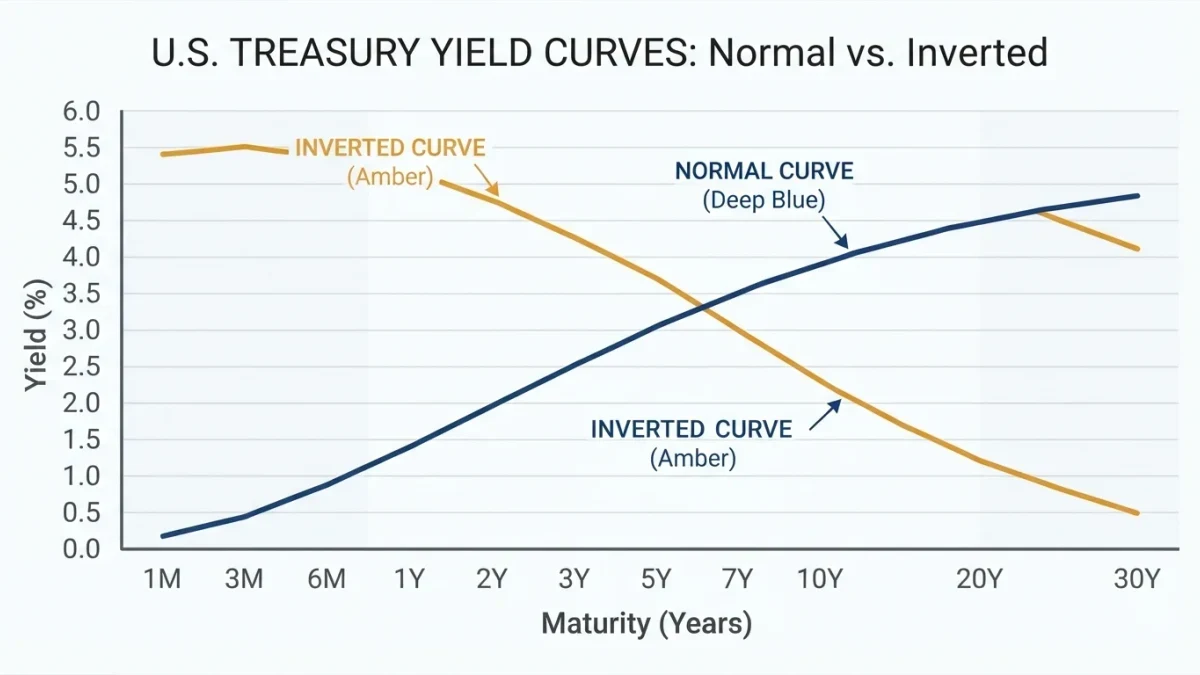
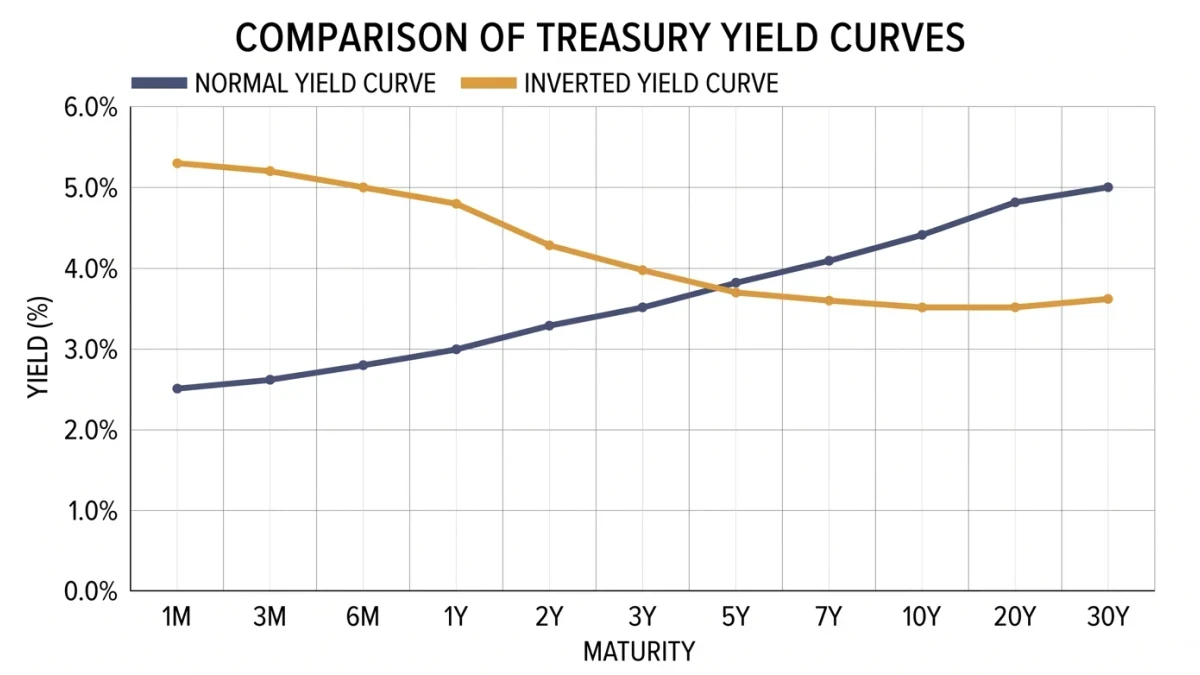
Two shapes dominate the conversation. A normal curve slopes upward — long rates above short — because lenders demand extra yield for longer commitment. An inverted curve, where short rates exceed long ones, has preceded every modern U.S. recession with famously imperfect timing, which is why it gets the headlines.
Why does the curve invert?
Inversion typically happens when markets expect the Fed to cut rates ahead — investors buy longer Treasuries to lock in yields before declines, pushing long prices up and long yields down, while short yields stay pinned by current policy. An inverted curve is therefore a statement about expectations, not a scheduled event: it says bond markets think policy is tighter than the economy can carry. The signal has produced false alarms and long lags — the 2022–2024 inversion extended well beyond most predictions — so it is a reason to check your own resilience, not to panic.
How does the curve price your loan?
A five-year fixed business loan is roughly the five-year Treasury plus your spread; a ten-year SBA-backed mortgage behaves similarly off the ten-year. That yields a practical insight most owners miss: you can watch the Treasury curve directly — it is free, daily, and published in full on the Treasury's own data pages — and know the direction your refinancing quote will move before you call the bank. When five-year yields have dropped half a point since your last financing, quotes will be better; when they have risen, brace for the spread conversation instead.
What should an operator actually do with it?
Use it for timing and structure, not prophecy. Timing: major fixed-rate borrowing — equipment, property, long refinancing — is cheapest, all else equal, when the relevant maturity's yield has fallen materially; the curve tells you when that has happened without waiting for a banker's quote. Structure: when the curve is steep, long fixed money is expensive relative to floating — a case for shorter instruments or floating lines for needs that are temporary anyway. When the curve is inverted, long fixed rates are, unusually, cheaper than short ones, which is the rare environment in which locking longer-term debt is favored purely on price.
What are the limits of the signal?
The curve aggregates what bond traders expect about the Fed and the economy; it knows nothing about your business. It also moves for technical reasons — heavy Treasury issuance, foreign official demand — that are about bond supply rather than economic forecasts. The honest use is as one input into a financing calendar that is driven by your own needs: borrowing ahead of a genuine need because the curve looks clever is market timing in a trench coat.
| Curve shape | What it implies | Operator read |
|---|---|---|
| Normal (upward) | Growth expected | Long fixed costs more than floating |
| Flat | Transition or uncertainty | Compare structures carefully |
| Inverted | Rate cuts expected | Long fixed is cheap on price; recessions often follow with a lag |
The curve is the wholesale price list for borrowed time. Reading it takes ten minutes a quarter and converts refinancing from a surprise into a scheduled errand.